

Run the grid on its real capacity with Operation & Control
Seven-day forecasts, dynamic ratings and flexibility for the control room and the field
Modern grid operations are a constant balancing act: EVs, batteries, heat pumps, distributed generation and unpredictable weather all meet on the same network, often within the same hour. The control room is where this complexity becomes visible first, and where the cost of a wrong decision is felt fastest.
Operation & Control turns your grid model, smart meter data and weather forecasts into hour-by-hour forecasts of loading, voltage and asset temperature for every transformer and cable, seven days ahead. Dynamic ratings replace static nameplate limits, and flexible customers and non-firm connections become capacity you can plan with. The result is a grid that runs closer to its true capacity, with fewer overloads, shorter outages and measurable improvements in SAIDI and SAIFI.
Operation & Control in numbers

Three capabilities, one platform


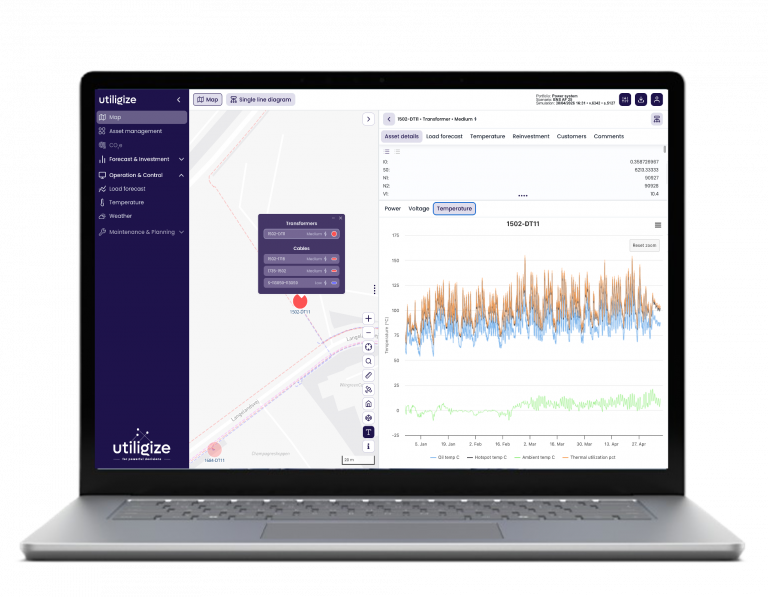
Dynamic capacity at no cost to asset life
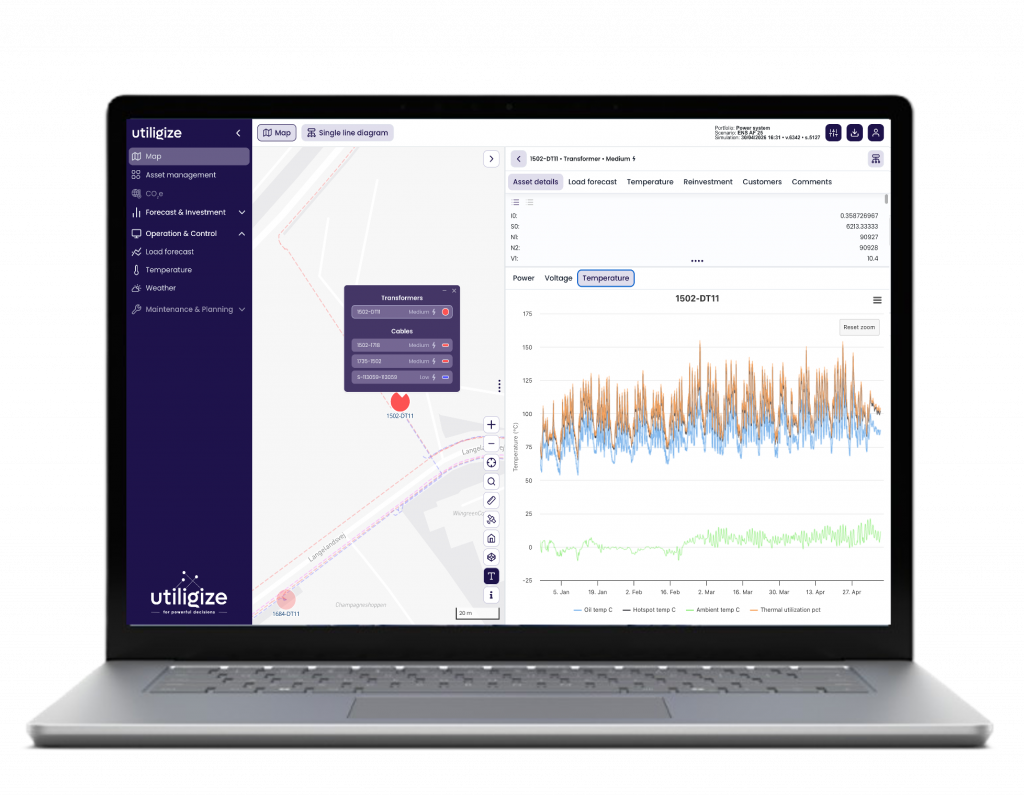
Ratings are computed every hour with the thermal models the standards prescribe: IEEE C57.91 for transformers and IEC 60287 for cables. No asset is ever rated above 105 °C top-oil and 120 °C hot-spot for transformers, or 90 °C conductor temperature for cables.
- Every transformer, down to the 10th percentile, holds at least +45% above nameplate in 98% of all hours, the hottest weeks included. The median holds +53%; the median cable +71%.
- The fleet delivers 150% of nameplate for 99.8% of winter hours.
- Ten hours at maximum dynamic capacity age the insulation 2.7 times faster in those hours: about 27 equivalent hours out of a 180,000-hour insulation life, or 0.015%.
- The rest of the time transformers run at 40–70 °C hot-spot and age at under 1% of the normal rate. Dynamic operation spends weather, not asset life.
Measured on a 20-month backcast of a Danish DSO portfolio: 1,542 transformers and 9,249 cables.
Key capabilities
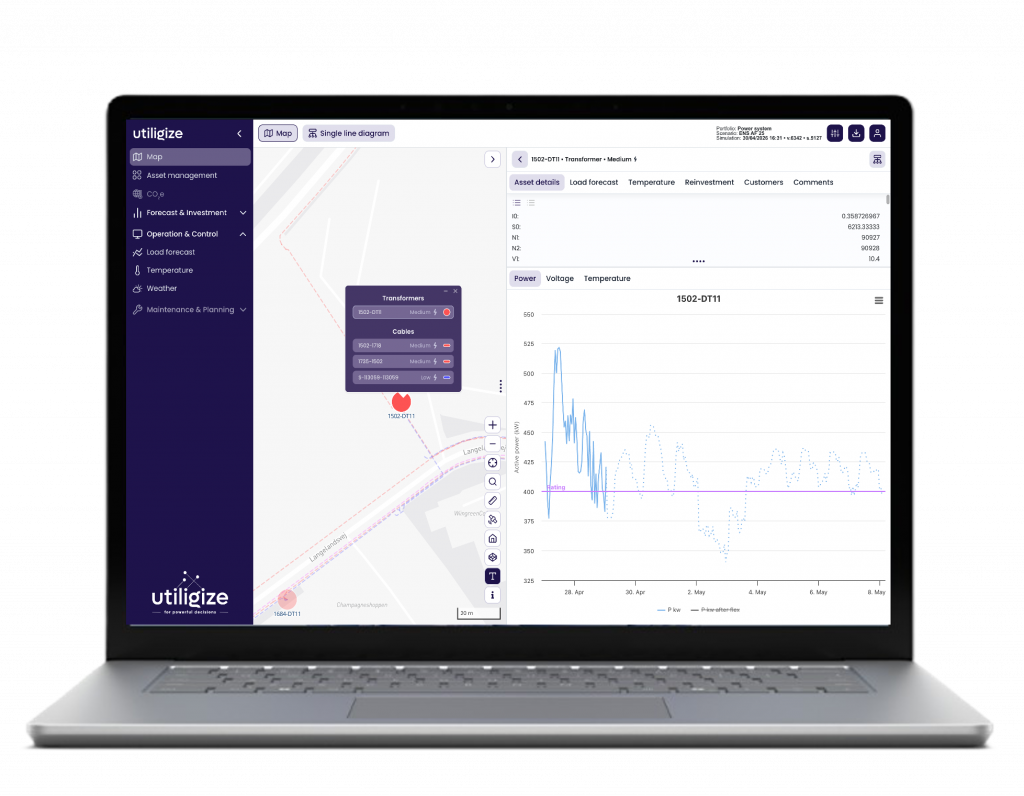
- Seven-day load and voltage forecasts, hour by hour, for every transformer and cable
- Asset temperature forecasts and dynamic ratings for cables and transformers instead of static limits
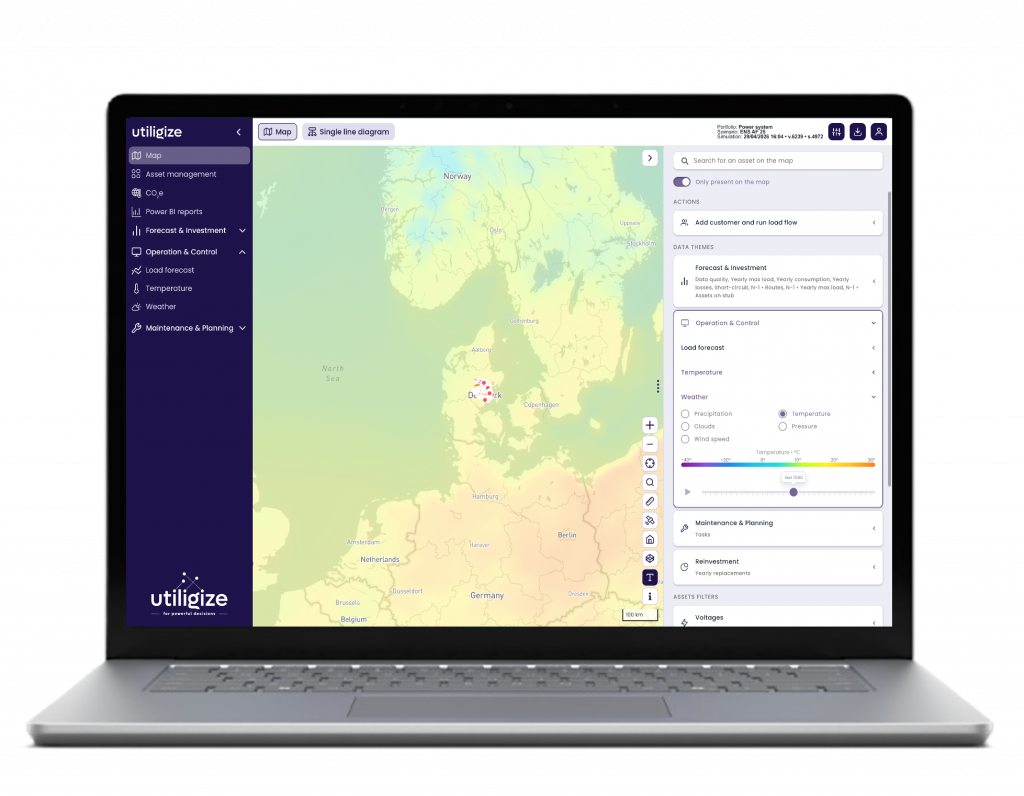
- Weather forecasts connected to grid loading, asset cooling, generation and outage risk
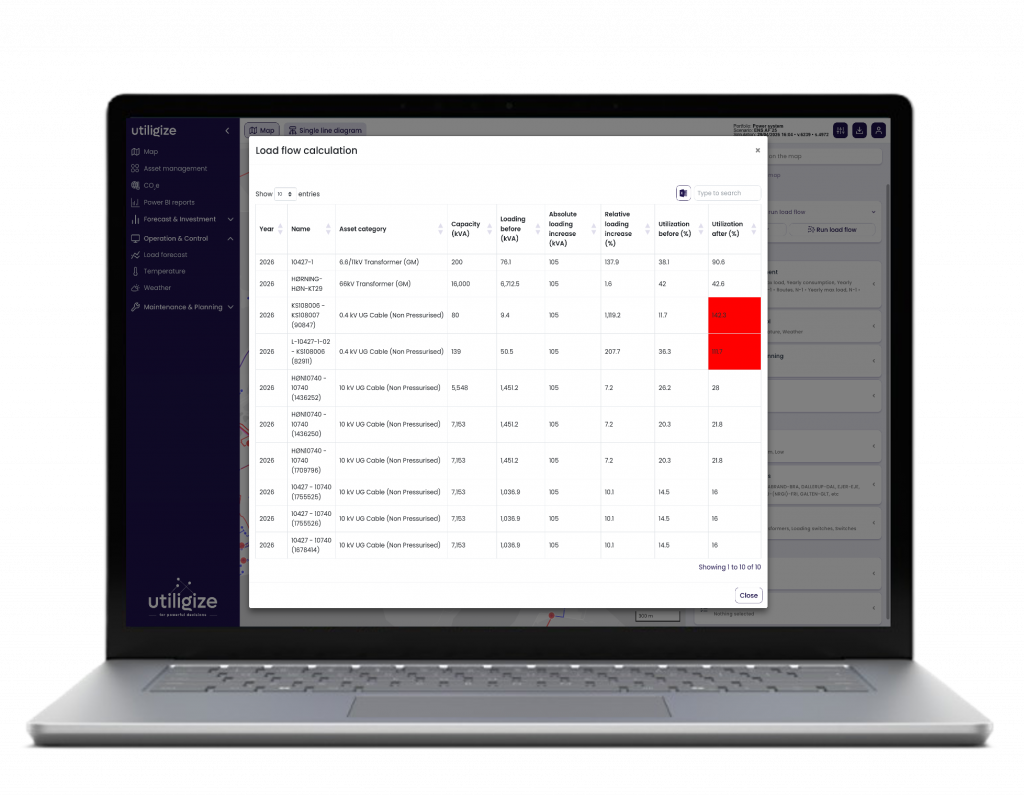
- Real-time loadflow on switch changes: loading, voltage, short-circuit values and losses
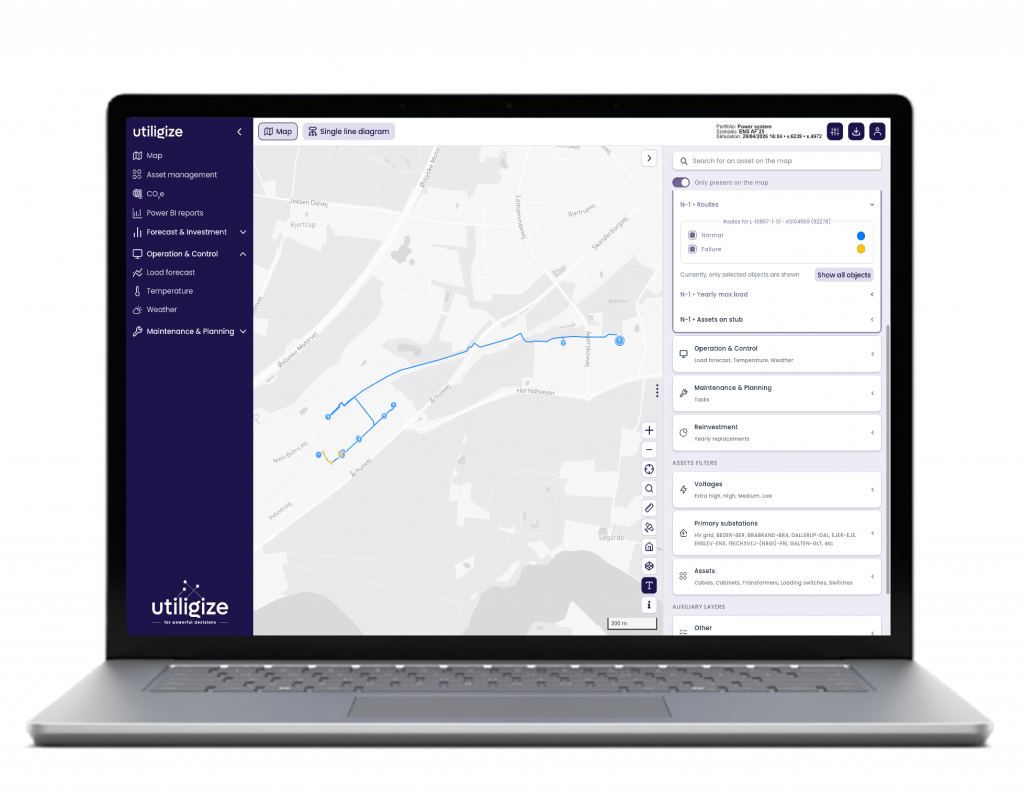
- N-1 calculations on outages, ranked by restoration speed and customer impact
- Flexibility activation and capacity signals for non-firm connections, simulated before you act

Built for every team
- Control room operators: live grid state, seven-day forecasts, switching simulation and restoration support
- Grid connection and flexibility teams: dependable capacity per asset for non-firm connections and flexibility agreements
- Technicians: validated switching plans and decision support in the field
- Outage response teams: affected customers and restoration priorities at a glance
- Operations managers: fewer overloads, shorter outages, better SAIDI and SAIFI
- Packages tailored to the needs, size and challenges of every utility
How it works
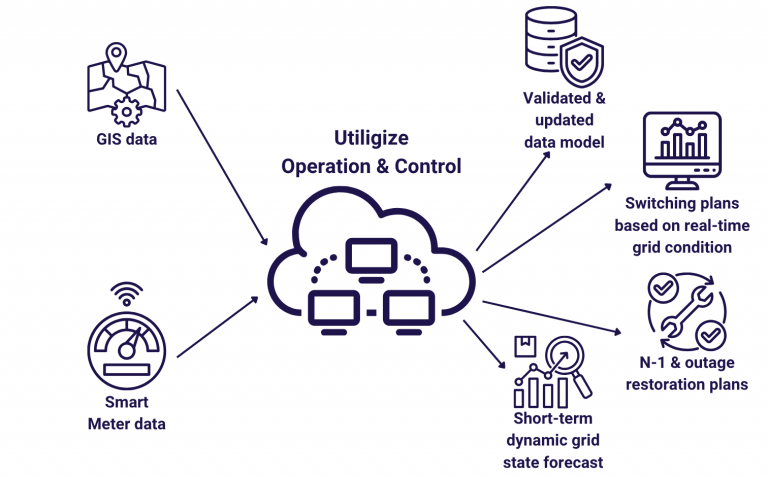
- Runs on your GIS grid model and smart meter data, updated daily and extended with current switch states
- Per-asset forecast models trained on two years of loadflow history and weather, refreshed every night for the whole grid
- Physics-based thermal models turn each forecast into asset temperatures and an hourly rating for every transformer and cable
- Real-time loadflow keeps a live picture of loading, voltage and losses; test any switch change or asset failure before acting
- Results in the platform and via API, as capacity signals for flexibility and non-firm connections
Learn more or request a demo?
Contact us